Install a tiny agent on Windows or Linux. We handle the rest: TimescaleDB, per-tenant Grafana orgs, clean dashboards, and secure access — automatically.
Built for MSPs, small IT teams, and indie devs who want signal — not setup.
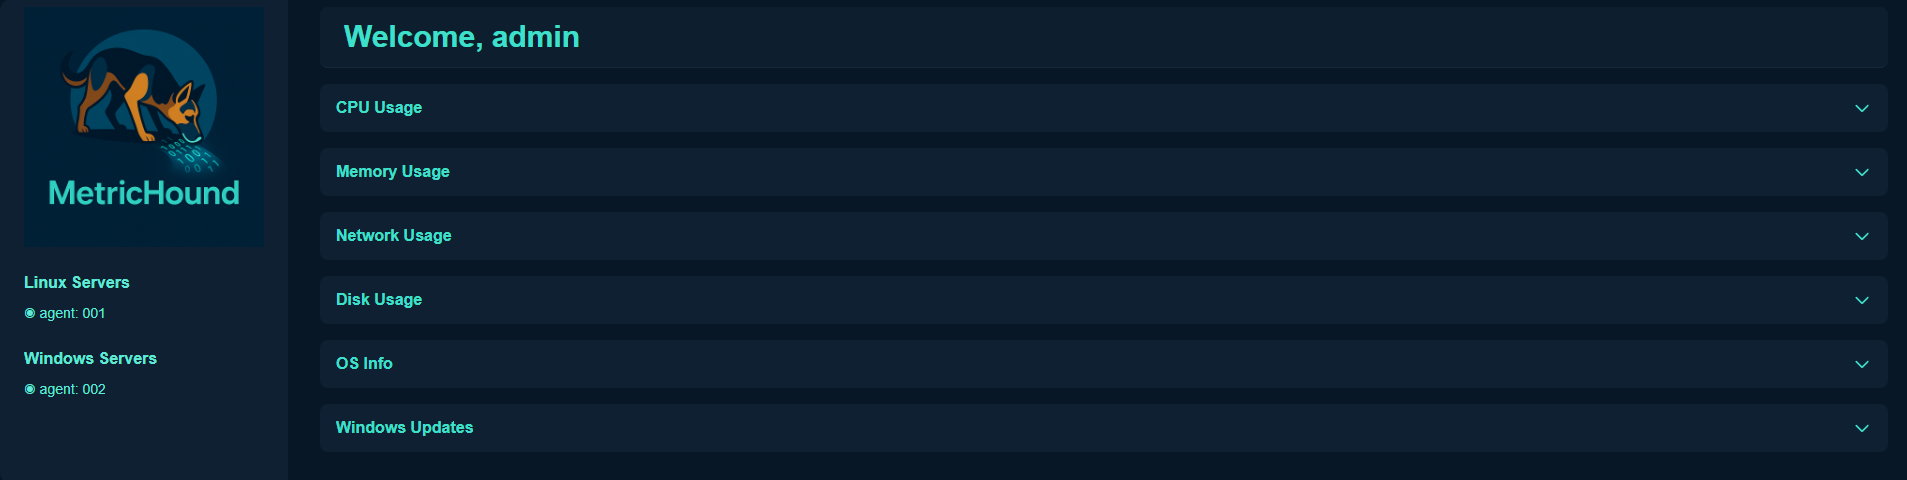
Illustrative dashboard. Actual UI may differ.
We trimmed the fat so you don’t pay for complexity you don’t use. The result: lower overhead and faster time-to-value.
Get a tenant ID, run the agent with your token, and your dashboards show up. No Grafana skills required.
No inbound firewall holes. If a host goes offline, metrics queue locally and resend when back.
Separate orgs & datasources by default. Clean boundaries, clean dashboards (acme.metrichound.com).
Your data stays in the EU (Frankfurt). Read replicas power dashboards so writes don’t get hammered.
Lean architecture, no bloat. Spend on outcomes, not orchestration.
Prebuilt CPU/RAM/disk/network dashboards out of the box. Alerts on Pro when you’re ready.
Start small. Grow when it makes sense. Everything you need to get value fast.
Great for solo devs & small teams
Includes 5 agents (≈ $4/agent)
For teams that need alerts & customization
Includes 5 agents
Need more than 25 agents? Contact us for custom plans.
Be first to try MetricHound, help shape the product, and lock in founder pricing. We’ll send your tenant URL and agent package as soon as your dashboard is ready.
Within minutes. Install the agent, and your tenant dashboards light up automatically.
No. We provision clean, read-only dashboards by default. Pro lets you customize if you want.
Agents queue locally and resend when back. No data lost during short outages.
EU (Frankfurt) on AWS. We aim for a lean stack with predictable costs and clear isolation per tenant.